Interactive Media Website -
Card Sort Report
An open card sort study meant to examine user preferences and inform the Interactive Media website redesign.
PROJECT SCOPE
-
Team: Joaddan Reme, Arielle Asare, Tirsa Fernandez
-
My Role: UX Researcher, Interview Coordinator
-
Timeline: 2 weeks
-
Toolkit: Figma, Microsoft Teams, Zoom, Optimal Workshop
-
Methods: Generative Research, Usability Testing, Wireframing + Prototyping

Executive Summary
Our group conducted an open card sort study for the items of the UM Interactive Media website. We were given the Directive and Hastily testing condition which means that we revealed to all 12 participants what the card sort was for before beginning. We also instructed each participant to complete that card sort as quickly as possible.
The purpose of this study was to examine user preferences for grouping, labeling, and placement of items on the UM Interactive Media website. We want to use the results from the study to inform the layout, navigation, content, and terminology of our redesigned UM Interactive Media website.
Methodology
Participants: 12 Participants
Format: Moderated 1:1 usability sessions.
Protocol: Open card sort with a Directive and Hastily condition using Optimal Sort.
Data Analysis: Average Task Time and Number of Categories.
Key Findings
-
Participants' overall sorting strategy took an item-driven approach.
-
Participants labeled groups based on common underlying card themes.
-
-
We used a similarity matrix to understand groupings and a dendrogram to visualize relationships for our redesign.
-
5 key categories were identified based on data: Application Information, Program Information, Resources, Socials, and Support.
This Report Includes
-
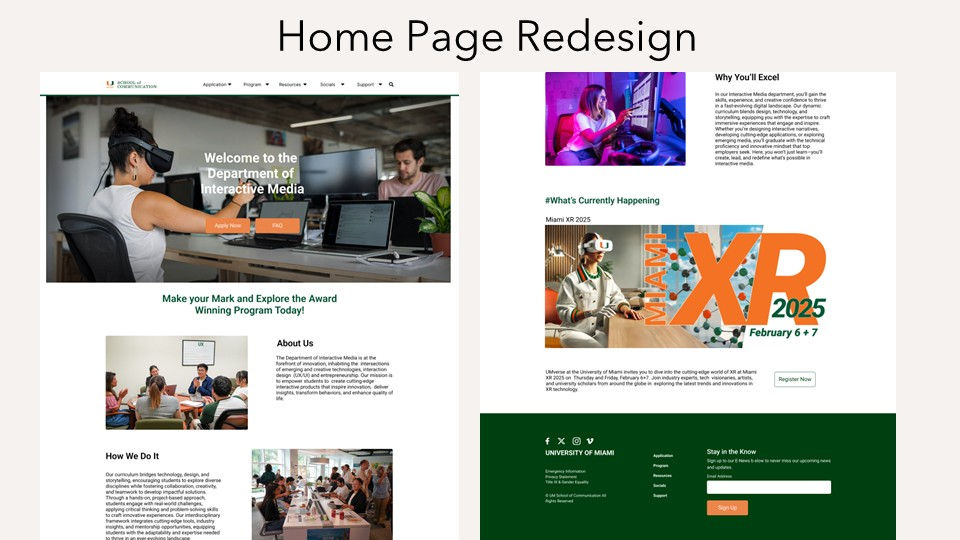
Recommended site map changes to primary and secondary navigation and a homepage re
-
Full testing methodology using Optimal Sort Workshop.
-
Detailed participant category and sorting strategy analysis using our Similarity Matrix and Dendrogram.
Methodology
Procedure
To conduct our card sort, we followed the exact steps below:
-
Introduce yourself and go through informed consent. Get permission to record Zoom session.
-
Have participant completed pre-sort questionnaire (demographics Q 1-10) before the card sort exercise.
-
Conduct card sort exercise with one participant at a time
-
Explain to the participant the purpose of this test and what is required– to help identify what categories of information should be on the site's home page and what those categories should be called. Inform participants that the items for website for a (University Degree Program/ UM Interactive Media). Emphasize that the sorting should be completed as quickly as possible.
-
Ask the participant to think out loud while working, so as to better understand the participant’s thoughts and rationale.
-
Have the participant arrange the cards into groups. Minimize interruptions, but encourage the participant to think aloud.
-
For each group, ask the user to name the group: What words would the user expect to see on the home page or second-level page that would lead the user to that particular group of cards?
-
Have participants “Finish” the sort when they have sorted all cards and labeled all groups.
-
Ask the participants to describe their sort strategy.
-
Have participants walkthrough the Interactive Media website (interactive.miami.edu) for 5 minutes. On completing the walkthrough, ask participants to complete the post-sort questionnaire.
-
At the end of the session, thank the participant for participating in the study and ask them if they have any questions.
Equipment
-
Optimal Workshop: Used for card sorting and demographic questionnaire.
-
Figma: Used to create sitemap and homepage redesign.
-
Laptops/Electronic Device: To navigate the website and take notes.
-
Zoom: To conduct the remote sessions and moderations.
- Word: Used to take moderator notes and transcribe Zoom sessions.
Item List
For this card sort, participants needed to sort a total of 43 cards:
-
Overview of the program
-
How to apply to the program
-
Details about application the process
-
Requirements for applying to the program
-
Program application deadlines
-
Application requirements for International Students
-
Information for International students applying to the program
-
Program tuition and fees
-
Online application for the program
-
Portfolio guidelines for applying to the program
-
How to send application supporting documents
-
Description of program concentrations
-
Featured student projects
-
Email Newsletter sign-up to stay informed of the program’s latest accomplishments and events
-
Access to program events calendar
-
How to follow the program on social media
-
Required courses
-
Elective courses
-
Information about the building where classes are taught
-
Description of a research facility that provides educational opportunities for students and offers a full range of research services to clients
-
About a student-faculty cooperative that functions as an incubator for initiatives that collaborate locally, nationally, and in the global space
-
Studio for research and testing grounds for virtual reality
-
Description of meeting space and student-run multimedia agency
-
Faculty profiles
-
Faculty and Student Awards
-
Where students get Internships and Jobs
-
Opportunities for Alumni
-
Career services and internships for students
-
Center focused on helping students and alumni develop career-related skills
-
How to hire our students
-
Companies and organization who partner with the program’s students on projects
-
Program donors list
-
Information for employers who want to post opportunities for alumni of the program
-
Posting jobs for students of the program
-
Information for companies and organization interested in developing partnerships with the
-
program
-
Information for those who are interested in donating to the program
-
List of Frequently Asked Questions (FAQs) about the program
-
List of Frequently Asked Questions (FAQs) about Miami
-
Program contact information
-
Link to the student information system used to search for classes, view course schedule,
-
and register for classes
-
Contact Information for program admissions
-
Language proficiency requirement for International students
-
Information about financial aid
Participant Outreach and Screening
A total of 12 UM current or prospective student participants above 18 were selected, with 4 per researcher. Those were the only must-have conditions for this study.
Our exact participant data pre-sort were as follows:
-
Ages ranged from 19-22
-
All 12 participants are current college students
-
All 12 of the participants understand spoken English very well
-
11 of the participants visits websites often for information while 1 participant only visits them sometimes.
-
When the participants visits websites, they utilize the IOS (Apple) platform with their tablets, laptops, desktops, and mobile devices.

Participant Findings (Post-Sort)
-
After the mandatory 5 minutes walkthrough of the UM Interactive Media website 6 participants stated they have already visited the website while 4 have not, and 2 were not sure/ didn’t know.
-
When asked how satisfied they were with the website the average was 4, satisfied.
-
They were then asked on a scale of 1 to 7 if the website met their requirements the average was 6, agree.
-
The participants agreed that the website was easy to use with with the average being a 6.
-
All 12 participants rated their website experience as fair and above (2 selected fair, 4 selected good, and 6 selected excellent.
-
Our participants gave us an average score of 5 when asked how likely are they to use UM’s Interactive Media website.
-
When asked how likely are they going to recommend the website to a friend or colleague the net promoter score was 0.
-
The UM Interactive Media net promoters score may be low due to our participants field of study not aligning with the website.
-
As stated from a participant, they are not likely to use the website or recommend it to a friend or colleague due to them not being in the School of Communications.
-
Results
Overall, the Cane Success website has critical usability problems based on task success, overall perception, and time on task. The website excelled in following key usability heuristics such as Aesthetic and Minimalist Design, but there are opportunities for improvement in navigation and functionality.
Average Task Time and Number of Groups
Key Takeaways:
-
Our participants took an average of 28 minutes and 8 seconds.
-
They created a total of 92 categories with a median of 8 categories each.

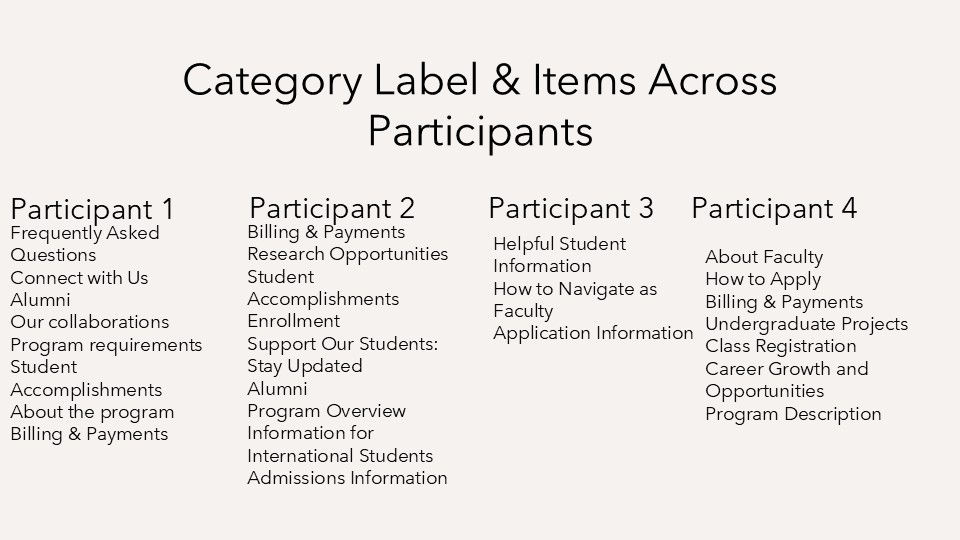
Participant Category Labels
After conducting our card sort, we identified the following category labels and items across participants for further analysis:


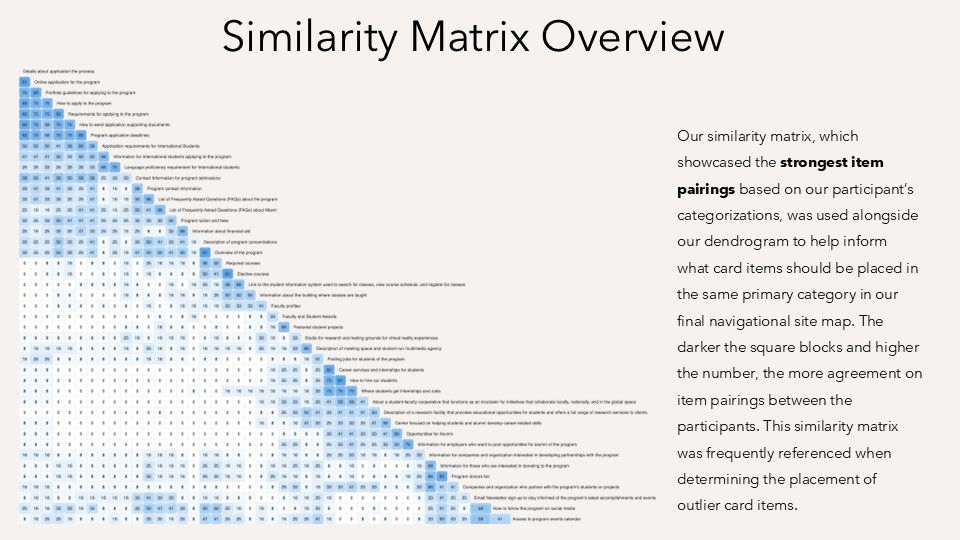
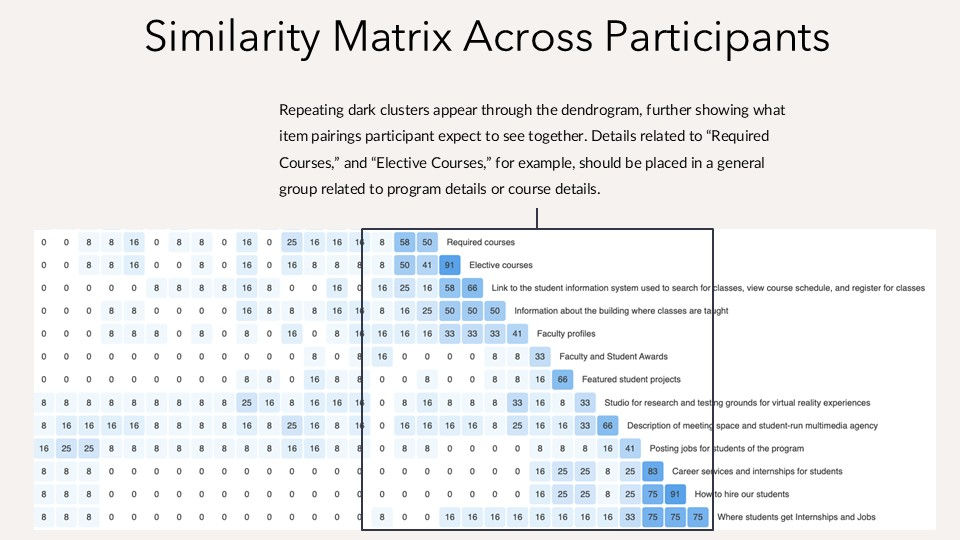
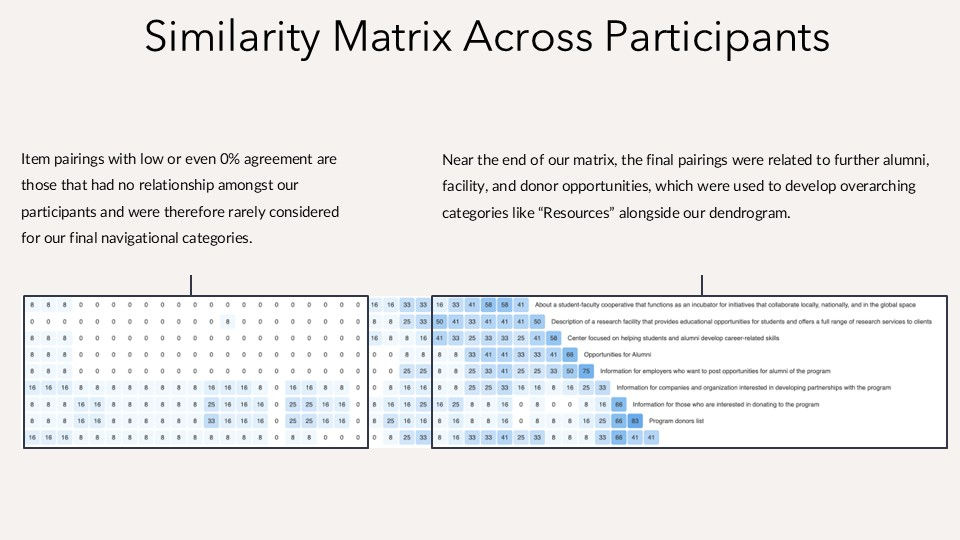
Similarity Matrix Findings
Using the Optimal Workship Similarity Matrix overview, we aimed to understand how participants grouped items and how that consequently informed our dendogram, and what this meant for our redesign.

Dendrogram
At 50% agreement, there were originally 11 categories outlined in our dendrogram, showing how participants naturally grouped the cards, with some outliers present. These categories broadly align with our final primary navigation. Some categories had strong agreements, while others were more loosely connected, requiring team re-interpretation and re-structuring.

Interpretation of Data Collected
-
Our directive and hastily testing approach was very direct so many of the participants has little to no questions and got to sorting right away.
-
All the participants sorted their card items based on keywords like “program” or “application” which led to similar naming in the groups like “How to Apply”, Program Information”, “Billings & Payments”, etc.
-
Participant's overall sorting strategy took an item-driven approach, grouping similar cards based on their experience as students thus far, and then named the broad categories according to the major keywords above. Thus, most participant's used clear descriptive labels based on common underlying card themes, with only a few creating unique category names.
-
We used our similarity matrix to first understand how participants grouped the items, and which were closely related, while supplementing our findings with the dendrogram to visualize the relationship and how closely participants associated them.
-
With 11 categories outlined in the dendrogram, we narrowed them down to 5 key categories based on participant categorization: Application Information, Program Information, Resources, Socials, and Support.
-
Isolated straggler cards that didn’t fit into a specific grouping, such as “Information about the building where classes are taught” were placed into one of the 5 categories based on the team’s executive decision and cross-referencing with the similarity matrix and PCA.